Budget Line
Definition: The Budget Line, also called as Budget Constraint shows all the combinations of two commodities that a consumer can afford at given market prices and within the particular income level.
We know that the higher the indifference curve, the higher is the utility, and thus, utility maximizing consumer will strive to reach the highest possible Indifference curve. But, he has two strong constraints: limited income and given the market price of goods and services. The income in hand is the main constraint (budgetary) that decides how high a consumer can go on the indifference map. In a two commodity model, the budgetary constraint can be expressed in the form of the budget equation:
Px . Qx + Py . Qy =M
Where,
Px and Py are the prices of commodity X and Y and Qx, and Qy is their respective quantities.
M= consumer’s money income
The Budget equation states that the consumer’s expenditure on commodity X and Y cannot exceed his money income (M). Thus, the quantities of commodities X and Y that a consumer can buy from his income (M) at given prices Px and Py can be calculated through the budget equation given below:
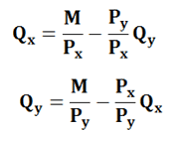

The values of Qx and Qy are plotted on the X and Y axis, and a line with a negative slope is drawn connecting the points so obtained. This line is called the budget line or price line.
Consumers Equilibrium
A consumer is in equilibrium when he derives maximum satisfaction from the goods and is in no position to rearrange his purchases.
Assumptions of Consumers Equilibrium
- There is a defined indifference map showing the consumer’s scale of preferences across different combinations of two goods X and Y.
- The consumer has a fixed money income and wants to spend it completely on the goods X and Y.
- The prices of the goods X and Y are fixed for the consumer.
- The goods are homogenous and divisible.
- The consumer acts rationally and maximizes his satisfaction.
n order to display the combination of two goods X and Y, that the consumer buys to be in equilibrium, let’s bring his indifference curves and budget line together.
We know that,
- Indifference Map: shows the consumer’s preference scale between various combinations of two goods
- Budget Line: depicts various combinations that he can afford to buy with his money income and prices of both the goods.
In the following figure, we depict an indifference map with 5 indifference curves – IC1, IC2, IC3, IC4, and IC5 along with the budget line PL for good X and good Y.

From the figure, we can see that the combinations R, S, Q, T, and H cost the same to the consumer. In order to maximize his level of satisfaction, the consumer will try to reach the highest indifference curve. Since we have assumed a budget constraint, he will be forced to remain on the budget line.
2 thoughts on “Budget Line and Consumer Equilibrium”